Moneydance is one of the popular alternative to Quicken and Microsoft Money for managing personal finance, budget and investments. Moneydance supports tracking of investment portfolios with support for stocks, bonds, CDs, mutual funds, and more.
Users can view the historical price and volume charts for various investment options, such as stocks, bonds, mutual funds, futures and etc. Moneydance automatically downloads and updates the current and historical prices of investments via the Quotes and Exchange Rates extension.
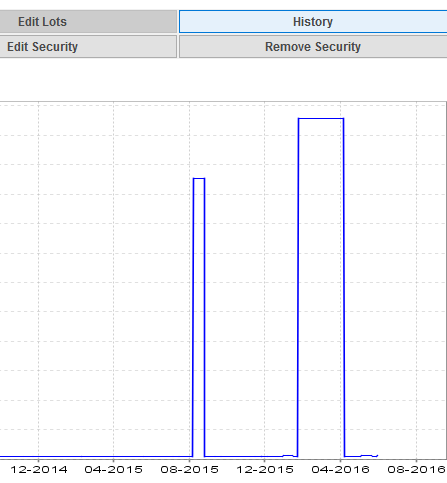
However, sometimes, the historical price and volume chart may be wrong or showing incorrect graph lines that corresponding to wrong prices. For example, on some days, the prices may spike or bottom without explanation. In addition, when there is no price history for a financial instrument, the chart would show some price entries even though there was no transaction made.
The cause for the wrong price chart in Moneydance is most likely caused by currency exchange rate issue, i.e. error happens because wrong exchange rate is been used to value the the price in the graph. So the issue is more prominent when the securities are quoted in foreign currency that is different from the base currency.
Resolution
- Open Moneydance.
- Go to Tools -> Currencies in the menu bar.
- Double click on the foreign currency which the security is quoted in (for example, stock listed in LSE quoted in GBP while base currency is in USD).
- Check through the currency’s price history for exchange rates that are incorrect, and edit the exchange rate or delete the exchange rate by selecting the line and clicking on Remove.
- Once all inconsistent exchange rates are fixed, go back to the price chart and the graph should show correct line.


